A business site I provide some support to runs on a GoDaddy virtual Linux server. We were having some performance issues so I dug into the available data and found we were hitting our memory limits. It seems the Virtuozzo system used by GoDaddy has hard and soft resource limits – you can go over the soft limits for short periods but after a while bad things start to happen. Like Virtuozzo shooting your processes in the head. As the applications and OS think they have the hard limit available, staying below the soft limit is problematic.
Virtuozzo makes status information available in /proc/user_beancounters. The different fields are pretty cryptic – their meanings are described in detail here.
The attached zip file contains two cacti template exported from Cacti version Version 0.8.7b, a snippet to add to the snmpd.conf on the server and a one line shell script called readbeans which is called by the snmpd agent. Deploy these latter items on your GoDaddy VM and suck the templates into Cacti. This will give you a “Virtuozzo Beancounters” data query which you can add to your device which should give you access to 20 graphs (don’t check resource, that one is bogus).
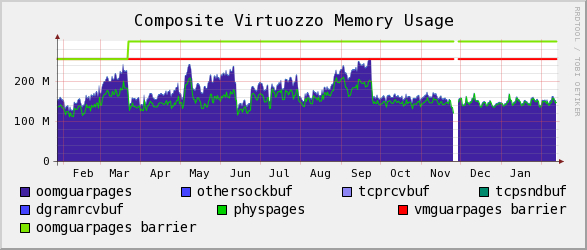
I found that building a compound graph like this brought together the most interesting values:
This long term graph shows where I implemented the crude but effective solution of restarting various system processes nightly (snmpd, httpd, mysqld, named and Plesk), some of which were gradual memory hogs.


