Recently went on a couple of training courses on NetApp fundamentals and performance. The tutors both recommended that every good NetApp admin should spend a few minutes every day looking at sysstat -x 1 scrolling up their screen. Of particular interest from a performance standpoint is consistency point activity. Consistency points are a checkpoint in time in the write cycle of the WAFL filesystem, and happen at any time OnTAP thinks it needs one, or every 10 seconds otherwise.
Gazing at sysstat is sound advice, but sounds like a job for a robot or a computer to me. Make the machines do the work is one of my maxims.
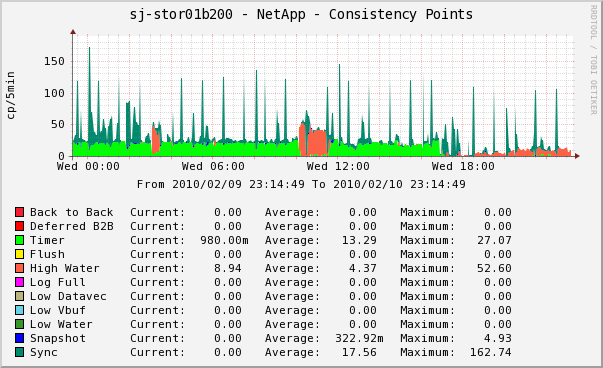
So I conjured up this cacti graph in class which will watch consistency point activity all the time. So far this has caught some very interesting middle-of-the-night activity, some of which coincided with application performance problems.

This sample graph shows the normal green of timer CPs from a relatively idle system, with periodic blue spikes triggered by the automatic hourly snapshot activity. The big flesh colored blob in the middle is a large copy operation that occurs as part of a legacy database backup process that we have not yet re-engineered to take advantage of snapshots. The right hand end of the graph shows what happens when doing a large myISAM to InnoDB database conversion – more on this when that project is completed. I’ve deliberately made the back-to-back and deferred-back-to-back CPs red as they are evil. The only time I have seen these is when a RAID group was reconstructing after the NetApp pulled a disk out for testing – performance really sucked that day for our gigantic myISAM tables. Most of our normal high activity periods are characterized by High Water CPs, though I have also seen occasional pink tinges of Log Full.
Here are what the different CP types mean, along with the corresponding letter prefix you will observe in sysstat and SNMP MIB name:
- Back to Back (B – cpFromCpOps) If you are getting these, your filer is overloaded. The write traffic is coming in faster than it can be written and the filer is running out of NVRAM capacity in one bank before the data in the other bank can be written. We got some of these during a RAID reconstruct. Bad news.
- Deferred Back to Back (b – cpFromCpDeferredOps). these are a worse version of the above. Definitely an overload problem.
- Timer (T – cpFromTimerOps) 10 seconds since the last CP – it means the system is pretty idle write-wise. Note that lightly writing to a NetApp may lead to more fragmentation than writing a bit more at a time, as it does not get the opportunity to stack stripes. Exercise is good.
- Flush (U – cpFromFlushOps) a flush happened. I’m sure it cleared something away.
- High Water (H – cpFromHighWaterOps) the number of RAM buffers holding modified data exceeded a threshold. Heavy write activity.
- Log Full (F – cpFromLogFullOps) the current NVRAM bank is full and the system switches to the other one and starts writing this to disk. Very heavy write activity.
- Low Water (L – cpFromLowWaterOps) the number of available RAM buffers dropped below a threshold.
- Low Datavec (D – cpFromLowDatavecsOps) the number of available datavecs (data vectors?) dropped below a threshold.
- Low Vbuf (V – cpFromLowVbufOps) the number of available virtual buffers dropped below a threshold.
- Snapshot (S – cpFromSnapshotOps) snapshots happen. It is a NetApp. Usually triggers a bunch of Sync (Z) CPs.
- Sync (Z – cpFromSyncOps) an internal sync – usually preparing to complete a snapshot.
This template was exported from Cacti Version 0.8.7e
2 Responses
Hi – I have an older version of this that is missing some of the newer cp types. Your template relies on a script to get the data (check_netapp_cp.pl) – would you be kind enough to also give a link to the perl script that supplies the data that the template uses?
Thanks –
Simon
Zip file updated – sorry about that.